Understanding Your Hearing Test Chart and Results
After you take a hearing test, your audiologist will show you a chart with
Evening & Saturday Appointments Available. LEARN MORE →
By: admin | January 19, 2026
After you take a hearing test, your audiologist will show you a chart with your results, and if you’ve never seen one before, it can look pretty confusing. There are lines, symbols and numbers that don’t immediately make sense unless someone walks you through it.
But those results contain important information about your hearing, and knowing what they mean helps you make better decisions about what to do next.
Whether you’re considering hearing aids, trying to understand why certain situations are harder than others, or just want to know where your hearing actually stands, being able to look at your test results and understand what they’re telling you makes a real difference.
Understanding your hearing test results puts you in control of your own information. You can track changes over time, have more informed conversations with your audiologist and feel less overwhelmed when discussing treatment options.
Hearing tests are designed to measure how well you hear across different pitches and volumes, helping identify changes or challenges in your hearing.
During a test, sounds are played or spoken at varying levels, and you indicate when you can hear them. This process gives a clear picture of how your ears respond to different frequencies and helps an audiologist understand the type and extent of any hearing changes.
Different tests focus on different aspects of hearing and are used for specific purposes. Some tests check how well you hear quiet sounds, others evaluate your ability to understand speech and some look at how the inner ear and auditory nerves respond to sound.
Some of the possible tests you might encounter include:
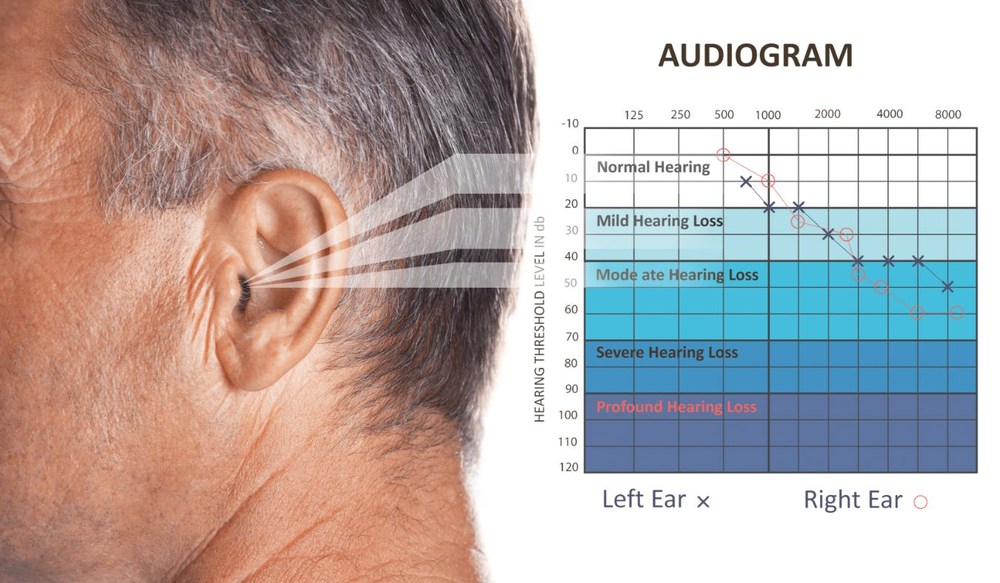
Your hearing test chart displays how well you hear a range of sounds. Symbols and lines show the softest sounds you can detect at different pitches. The horizontal axis represents pitch, from low to high, while the vertical axis shows loudness, from soft to loud.
Each ear is marked separately, often using different colors or shapes. This makes it clear if one ear hears better than the other. The chart may also include results for speech understanding, which shows how clearly you hear words in quiet or noisy settings.
Everyday sounds vary in pitch and loudness. For example, a phone ringing is high-pitched, while thunder is low-pitched. Your ears may pick up some pitches more easily than others, and loudness matters because some people hear soft sounds but struggle with louder ones.
Specialists measure both pitch and volume to understand your hearing in real-life situations. Testing across a range of sounds gives a complete picture of your hearing abilities. This information helps our team recommend the best support for your needs.
The main sections of your hearing test chart can seem overwhelming at first glance. The chart is divided into areas that show how well you hear different pitches and volumes for each ear. Symbols, lines and numbers mark your results.
If you find the chart confusing, ask our team to explain each part using simple examples or familiar sounds. This can help you connect the information to your daily experiences and make sense of your results.
Each symbol and line on your hearing test chart has a specific meaning. Circles often show your right ear’s results, while Xs mark your left ear. Lines connect these symbols to show how your hearing changes at different pitches.
You might also see brackets or other shapes if extra tests were done, like testing with headphones or a special headband. These marks help you and our team see patterns in your hearing and identify which sounds are easier or harder for you to hear.
Decibels measure how loud a sound is, while frequencies indicate the pitch, ranging from low bass tones to high squeaks. Most people can hear sounds between 20-20,000 Hertz (Hz), though everyday speech typically falls between 250-8,000 Hz. For reference, a normal conversation usually measures around 60 decibels (dBs), while a whisper is closer to 30 dBs and a busy street can reach 80 dBs or more.
Your hearing ability is determined by how well you detect different pitches at varying loudness levels.
Some people may have difficulty with high-frequency sounds like birds chirping or the consonants in speech, while others may need louder sounds to notice lower frequencies. On a hearing test chart, these differences show which pitches and volumes you hear easily and which ones require more amplification.
Normal hearing is shown when your results fall within the range of 0 to 25 dBs across all tested pitches. This means you can hear both low and high sounds at soft volumes without much difficulty.
Checklist for normal hearing on a test chart:
Different levels of hearing loss appear as patterns on your hearing test chart, based on how far the symbols fall below the normal range of 0-25 dBs. The lower the symbols are on the chart, the greater the degree of hearing loss.
Checklist for understanding your results:
Speech testing results provide insight into how well you can hear and comprehend spoken language. These tests measure your ability to repeat words or sentences presented at different volumes and in various listening conditions, including quiet and noisy environments.
They give a clear picture of not just whether you can detect sounds, but whether your brain can accurately process and interpret speech.
Low scores on speech understanding tests indicate that you may miss parts of conversations even if you can hear certain tones or sounds. For example, you might hear background noise or individual syllables but struggle to put together complete words or follow a discussion in a crowded room.
These results identify specific challenges with understanding speech and provide a framework for tracking changes in your hearing over time.
Speech testing displays which situations are most difficult for comprehension and gives a detailed view of how hearing affects everyday communication. This information allows you and your audiologist to see patterns in your hearing abilities and create a clear reference for managing conversations at home, at work or in social settings.
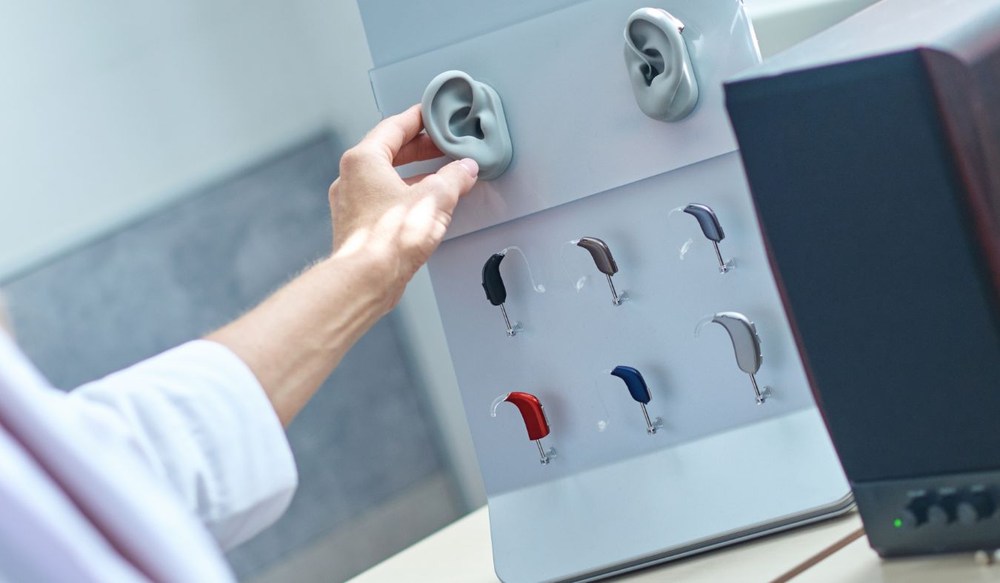
When hearing changes are identified, one of the most common approaches is using hearing aids. These devices are designed to help you hear more clearly in everyday situations, from quiet conversations at home to background noise in busy places. Discussing hearing aids with your audiologist gives you the chance to learn how they could support your communication and make daily listening less tiring.
During this conversation, your audiologist will explain different styles and how hearing aids can adjust to different environments. You can talk about what matters most in your daily life, like following conversations with family, hearing on the phone or listening at work.
Hearing aids can help make conversations easier to follow and reduce the mental effort it takes to listen throughout the day.
Looking at your hearing test results can feel overwhelming at first, but they give us a clear picture of how your ears respond to different sounds. The chart and numbers show where you may have more difficulty hearing certain pitches or volumes, and they explain why some situations feel harder than others. Having this information helps our team understand what you experience in daily life and allows us to guide you through your listening challenges.
If you have questions or want guidance on next steps, our team at Audiology Partners, LLC in Marlton, NJ at (856) 712-1933 can help. Going over your results together lets us track any changes, answer your questions and discuss treatment options.
After you take a hearing test, your audiologist will show you a chart with
By: admin | January 19, 2026
Choosing a hearing aid isn’t about finding the single
By: admin | November 18, 2025

Hot weather activities shouldn’t require you to worry constantly
By: admin | September 24, 2025